Variance Analysis is a critical tool in the world of FP&A, and we're excited to announce that we've greatly enhanced Modeloptic's Variance Analysis capabilities.
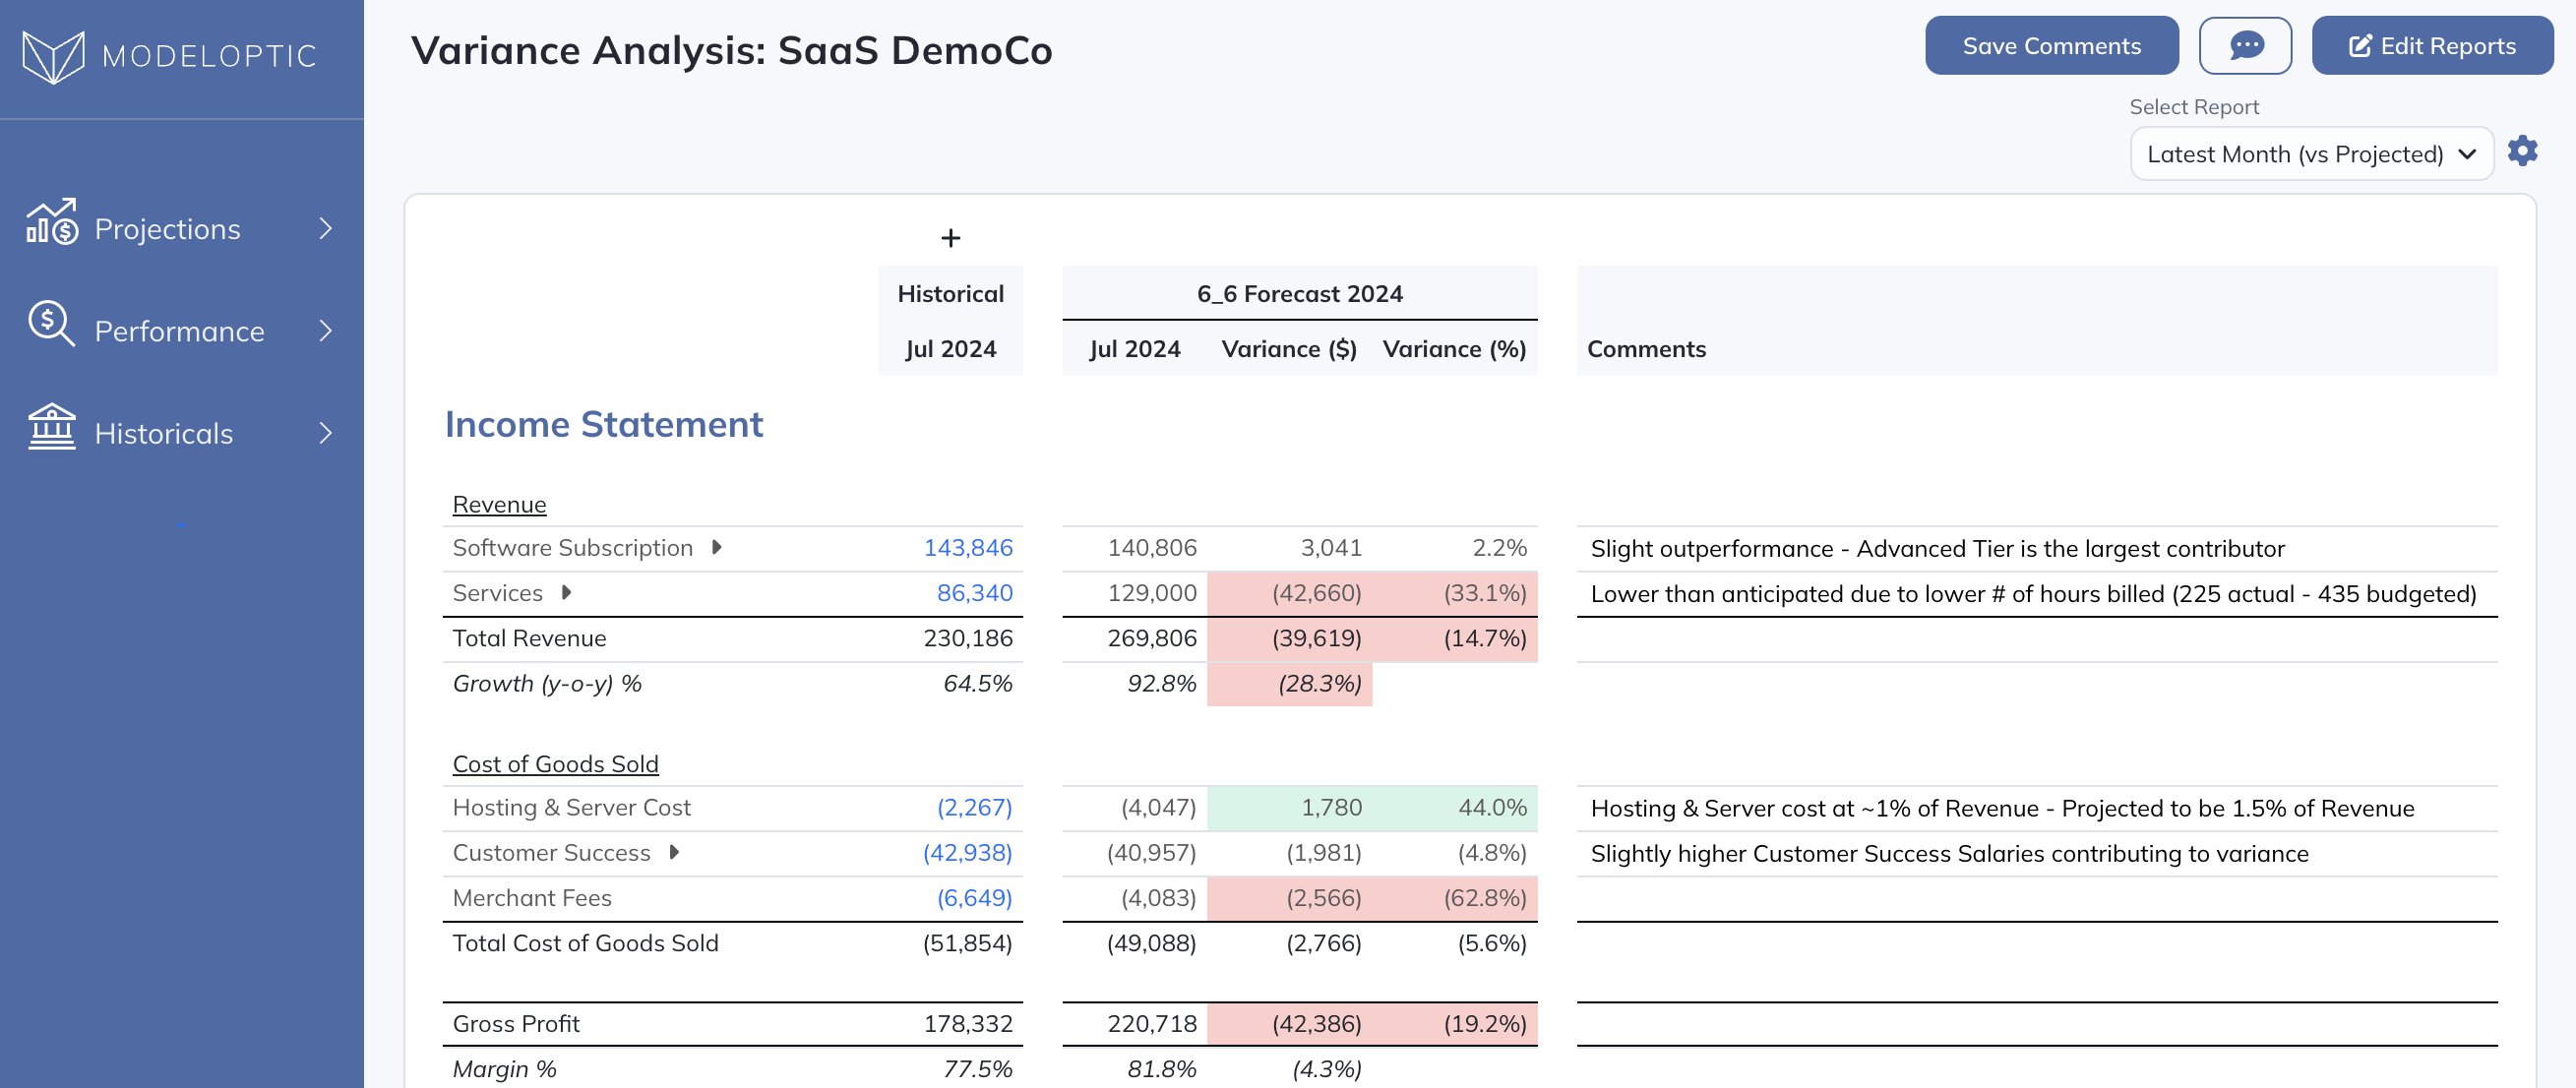
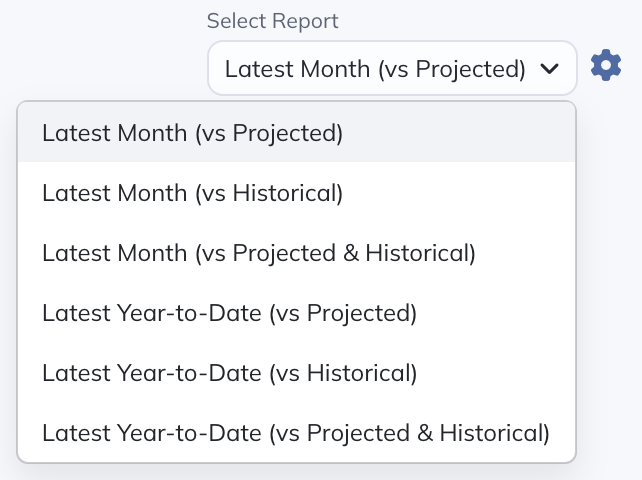
If you navigate to the Variance Analysis page, you now have the ability to toggle between several different variance reports, create new ones, and customize them as desired:
If you click on "Edit Reports", you'll see the available options:
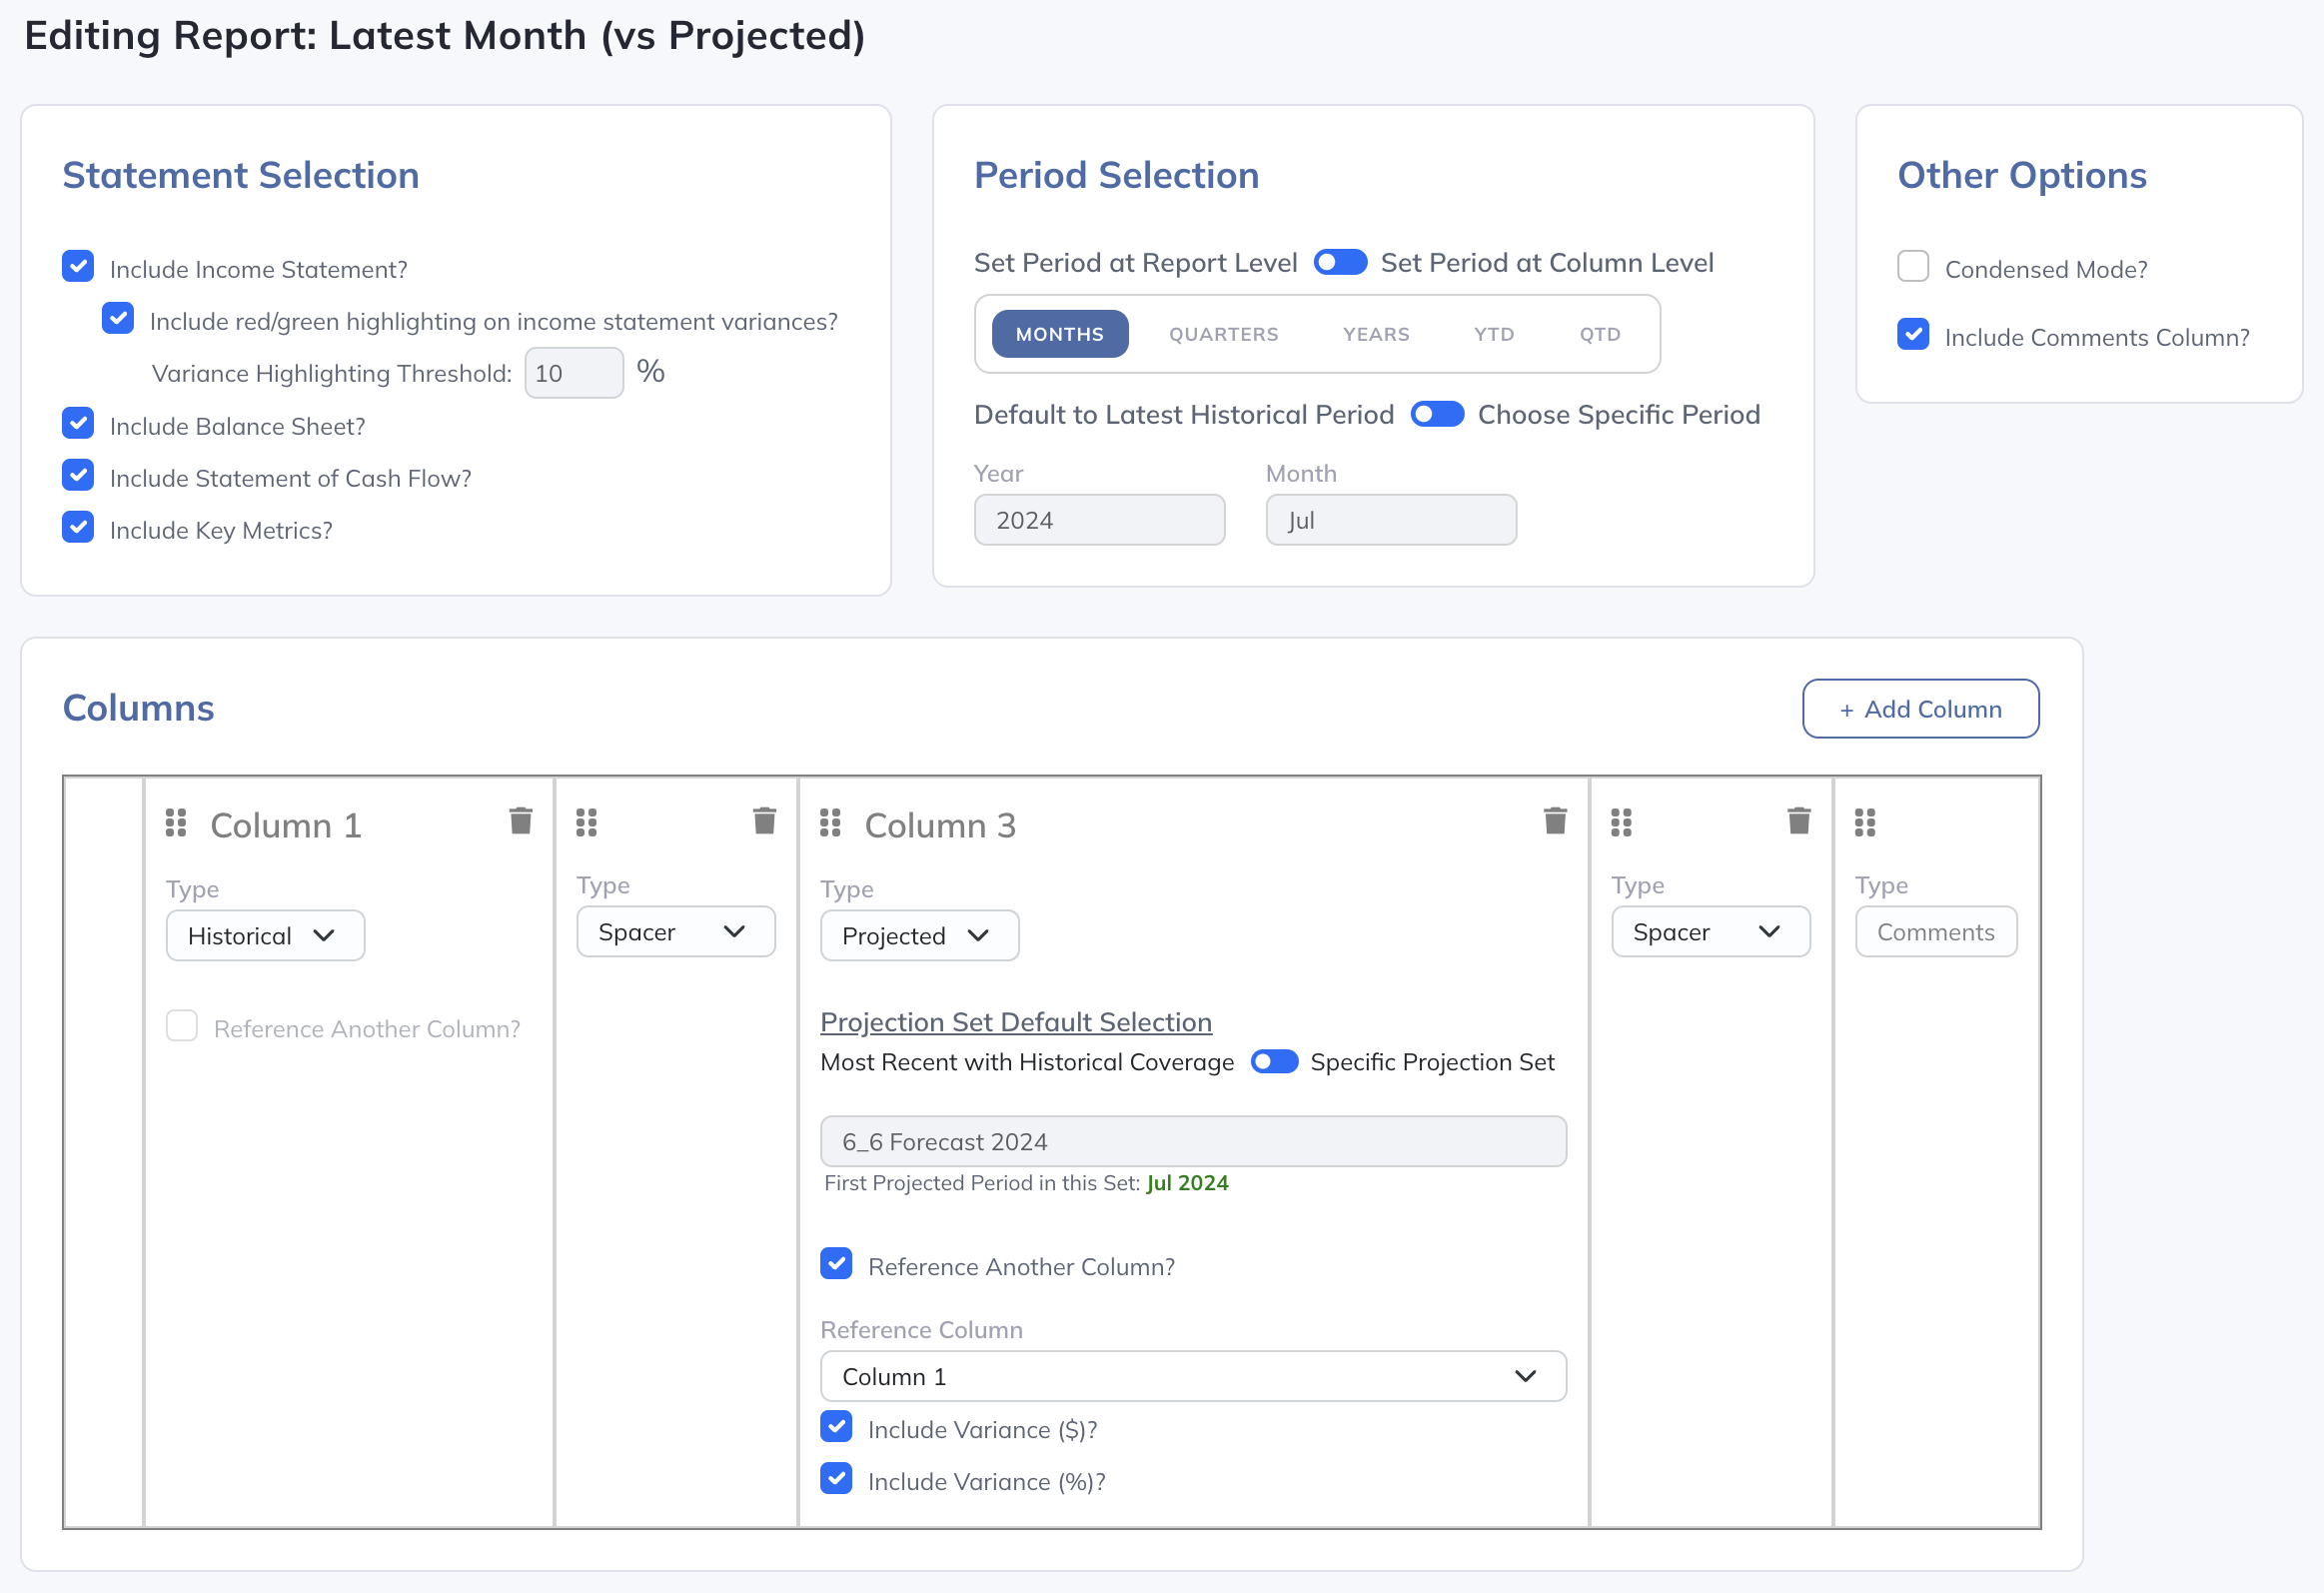
There are many different ways to go about analyzing a company's performance, and Modeloptic now gives you greater power and flexibility to configure your variance reports as desired.
Common report structures include:
- Latest Historical Month vs Annual Budget
- Latest Historical Month vs Prior Month's Rolling Forecast
- Latest Historical YTD vs Annual Budget
- Latest Historical Month vs Prior Month & Same Month of Prior Year
- Current Year Upside Case Projections vs Base Case Projections
You can learn more about these new capabilities in the Variance Analysis section of our documentation.
As before, Modeloptic enables you to see transaction level detail from directly within your variance reports. Simply click into any historical number to open up the transaction detail underneath:
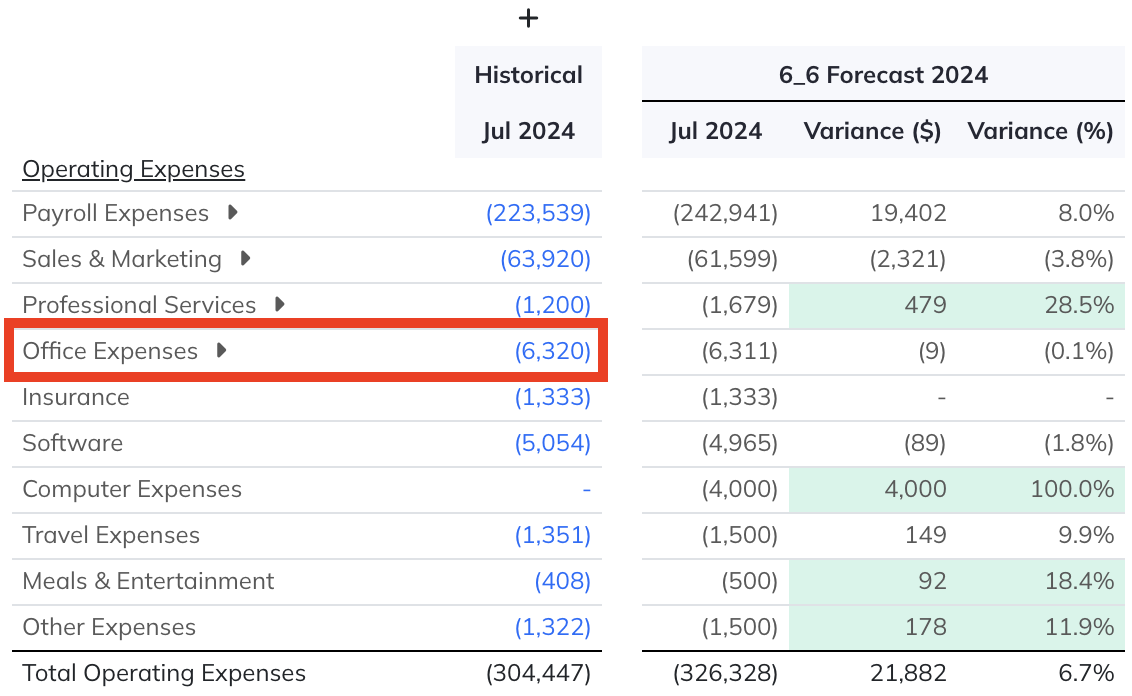
Clicking in will show you the constituent transactions:
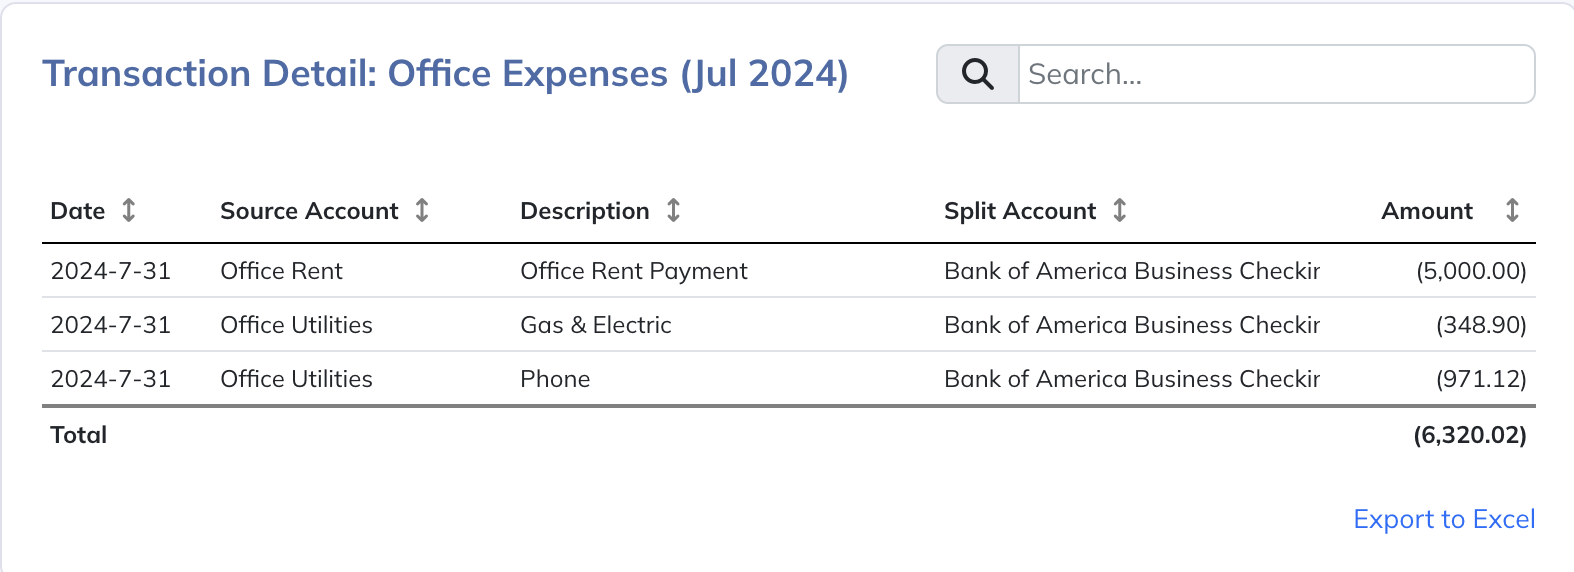
This is a surprisingly powerful capability that most customers find themselves using routinely, both during monthly and quarterly financial reviews as well as in the course of their monthly close process.
We hope you'll find these upgraded capabilities useful in managing your business and evaluating your company's performance. As always, we strive to help you spend less time on analyst tasks and more time on strategy.

